
Neogrid
At a glance
The Dashboard
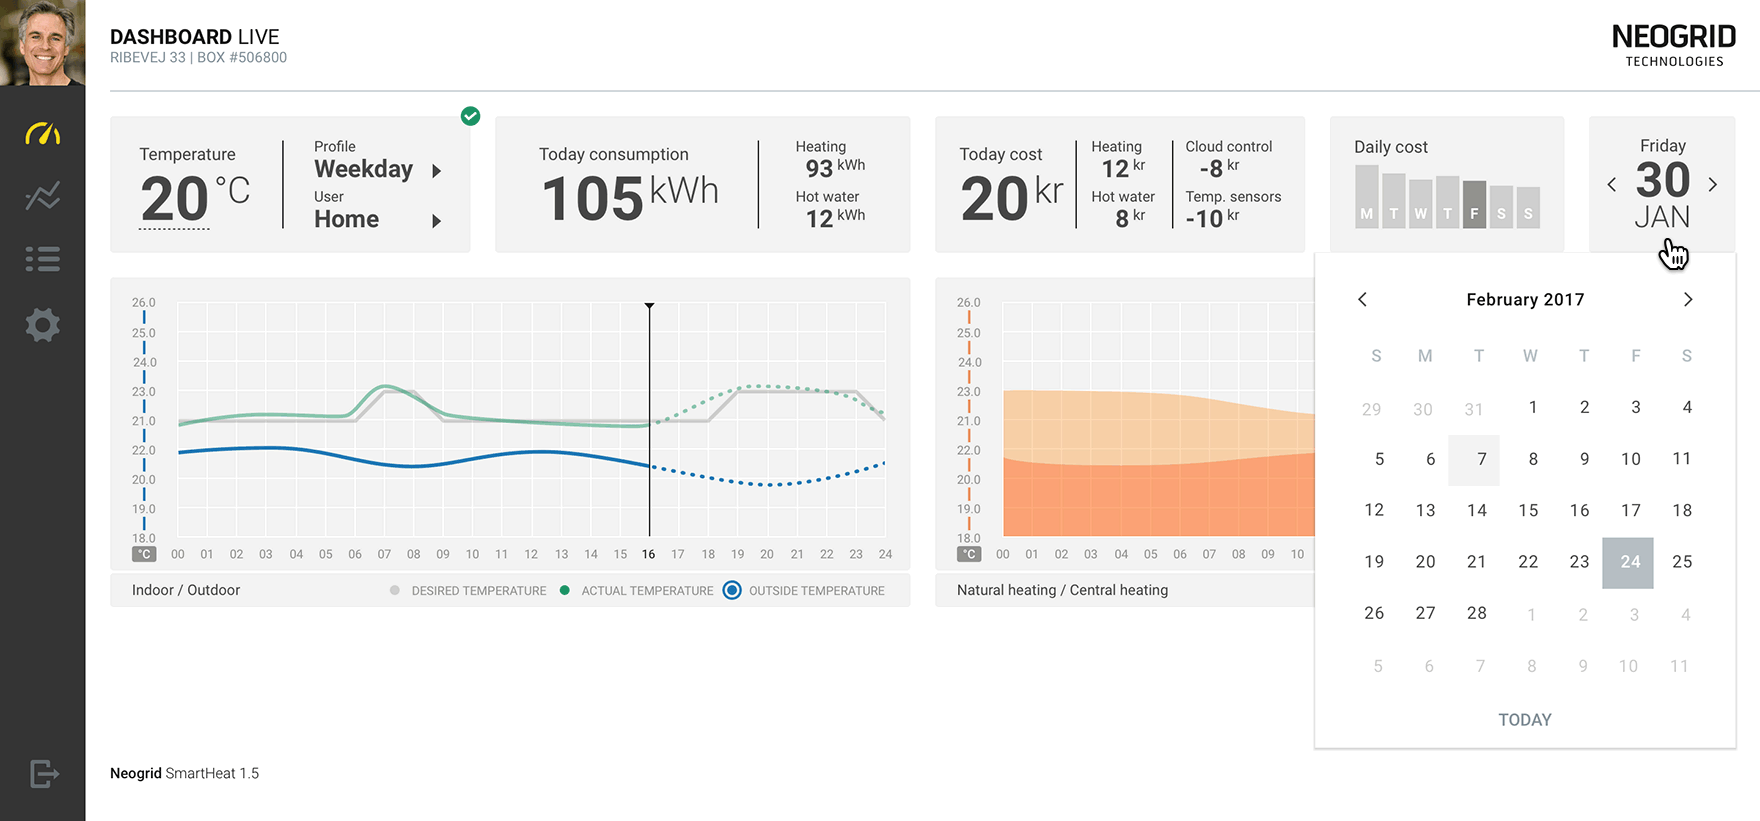
The Live Dashboard is an easy to use but powerful tool, allowing users to quickly monitor and modify key system parameters. For example: although deceptively simple, the Indoor / Outdoor graph compares indoor and outdoor temperatures to user’s desired indoor temperature not only in the past, but also in the future – using weather forecasts.
Smart and flexible
Smart widgets
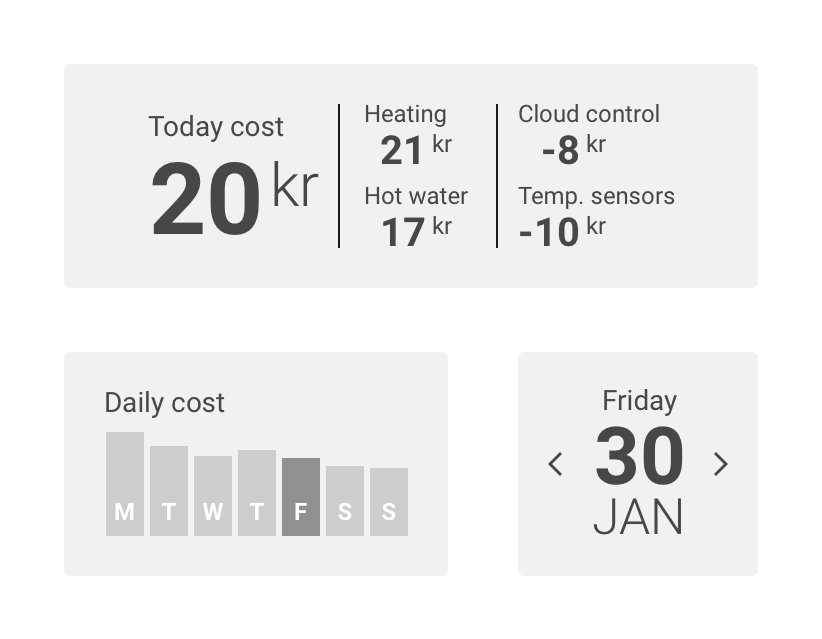
Today Cost breaks down the today's expenses into heating and hot water consumption. Of course, 21 + 17 equals 20 only if you have PreHEAT installed. Savings are also broken down by the installed options.
Daily cost is an interesting, multifunctional widget. At first, you can see the daily costs trend during a week. The current day is preselected, but you can go into the past to see the last 4 days worth of savings or 2 days into the future, to see the estimated costs. This widget is, of course, synchronised with the date selector and also with the graphs below, basically the entire screen.
Responsive (by) design
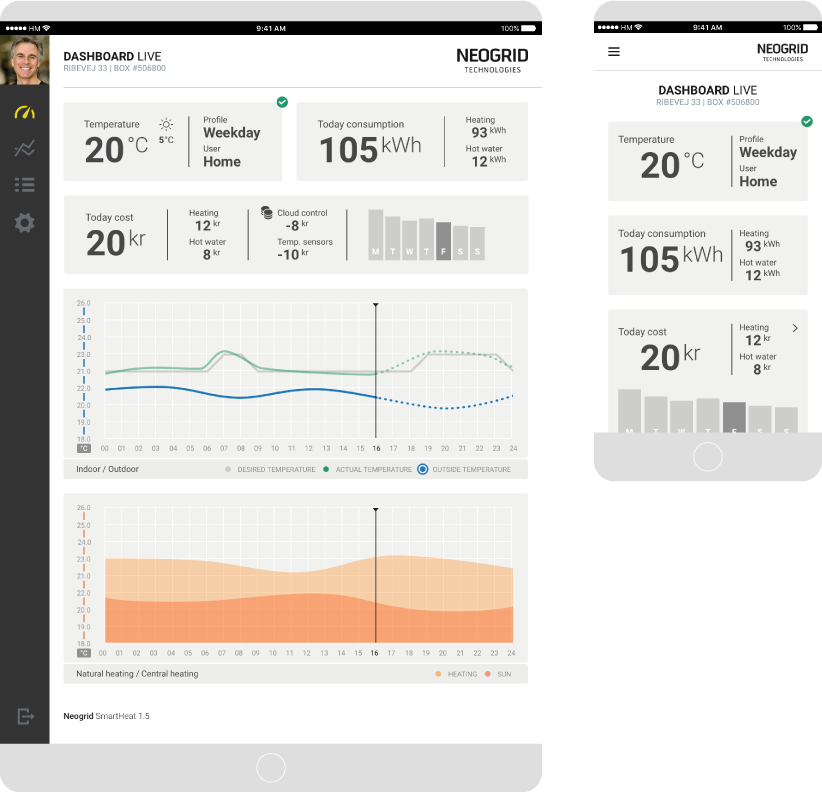
The whole application runs smoothly on desktops, tablets and smartphones. The adaptive, modular design permits easy scaling, no matter how diverse the elements are – graphs, charts, tables, etc.
Digging deeper
The Meters Datasheet
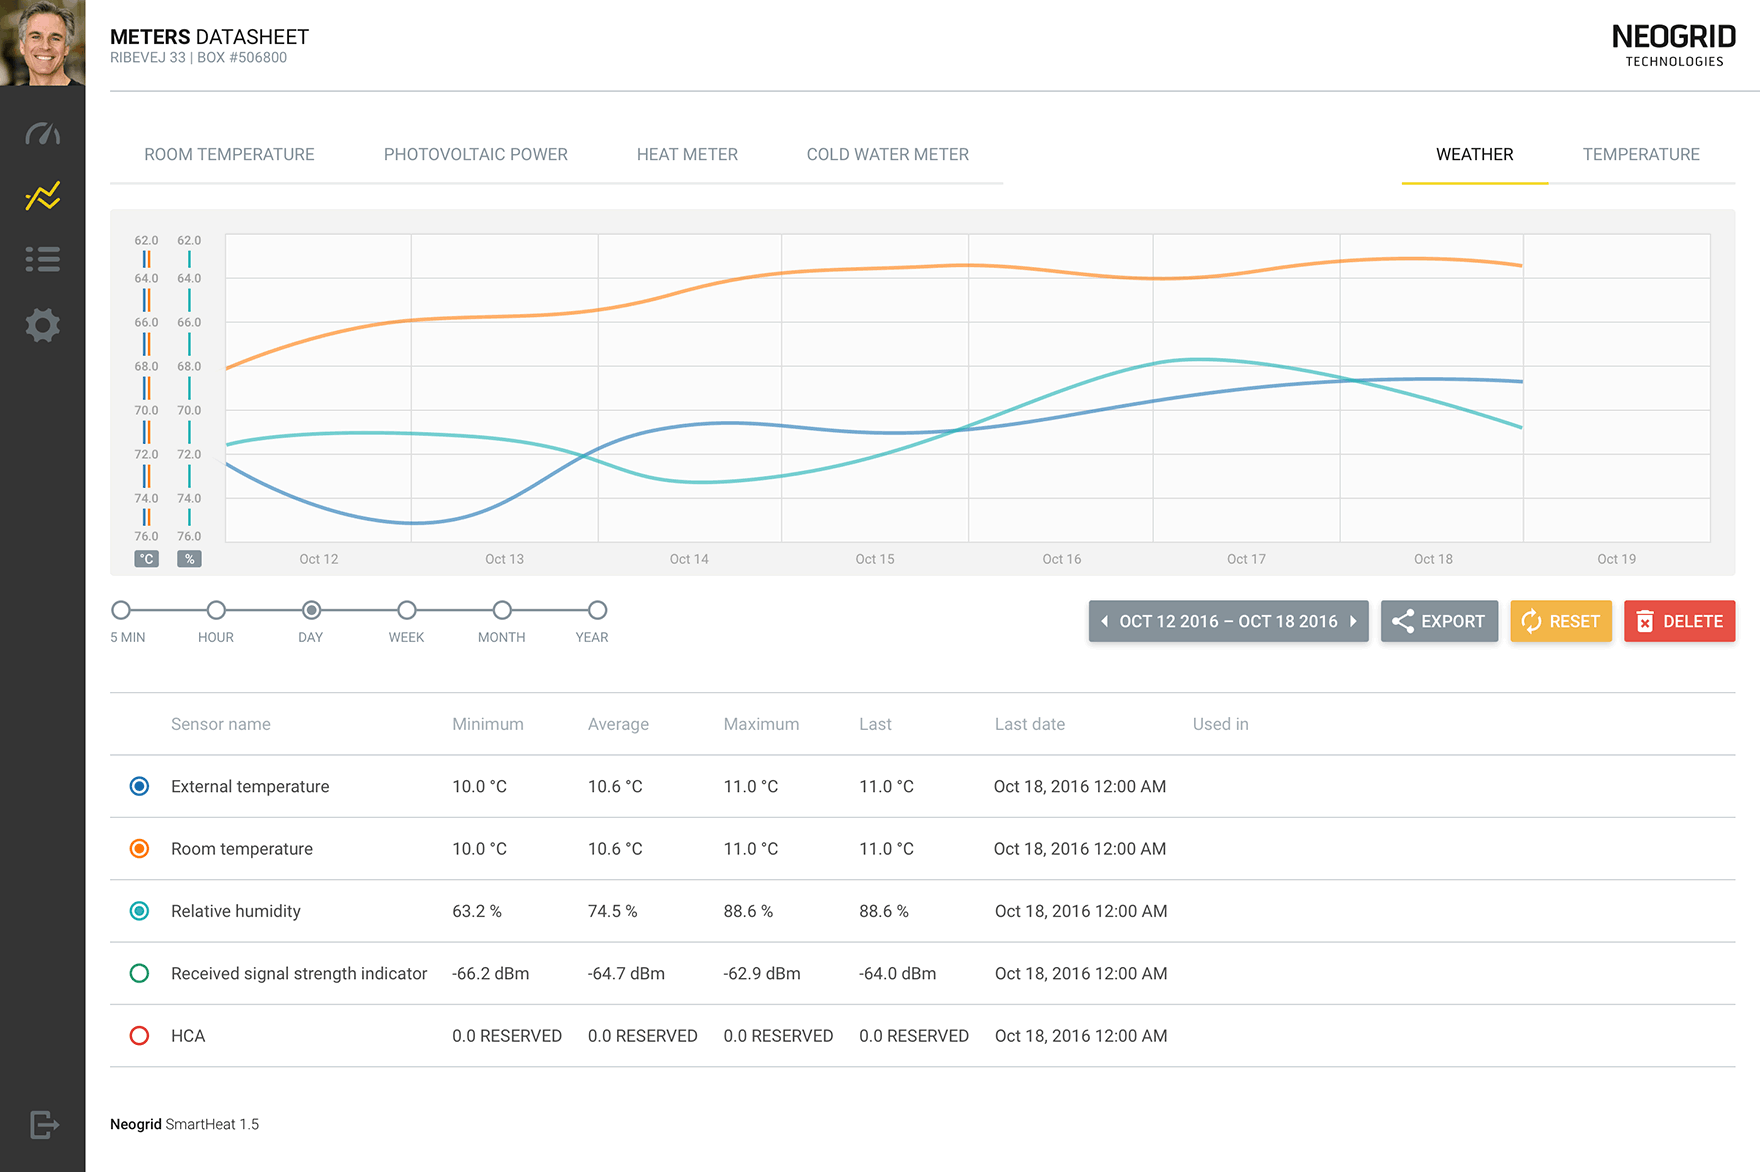
You can see here the individual devices (meters) installed in your home, and all the readings from the sensors. You can also organise the sensors' readings into "virtual devices", sorting, for example, all the weather data – temperature, humidity, etc. – into a Weather virtual meter.
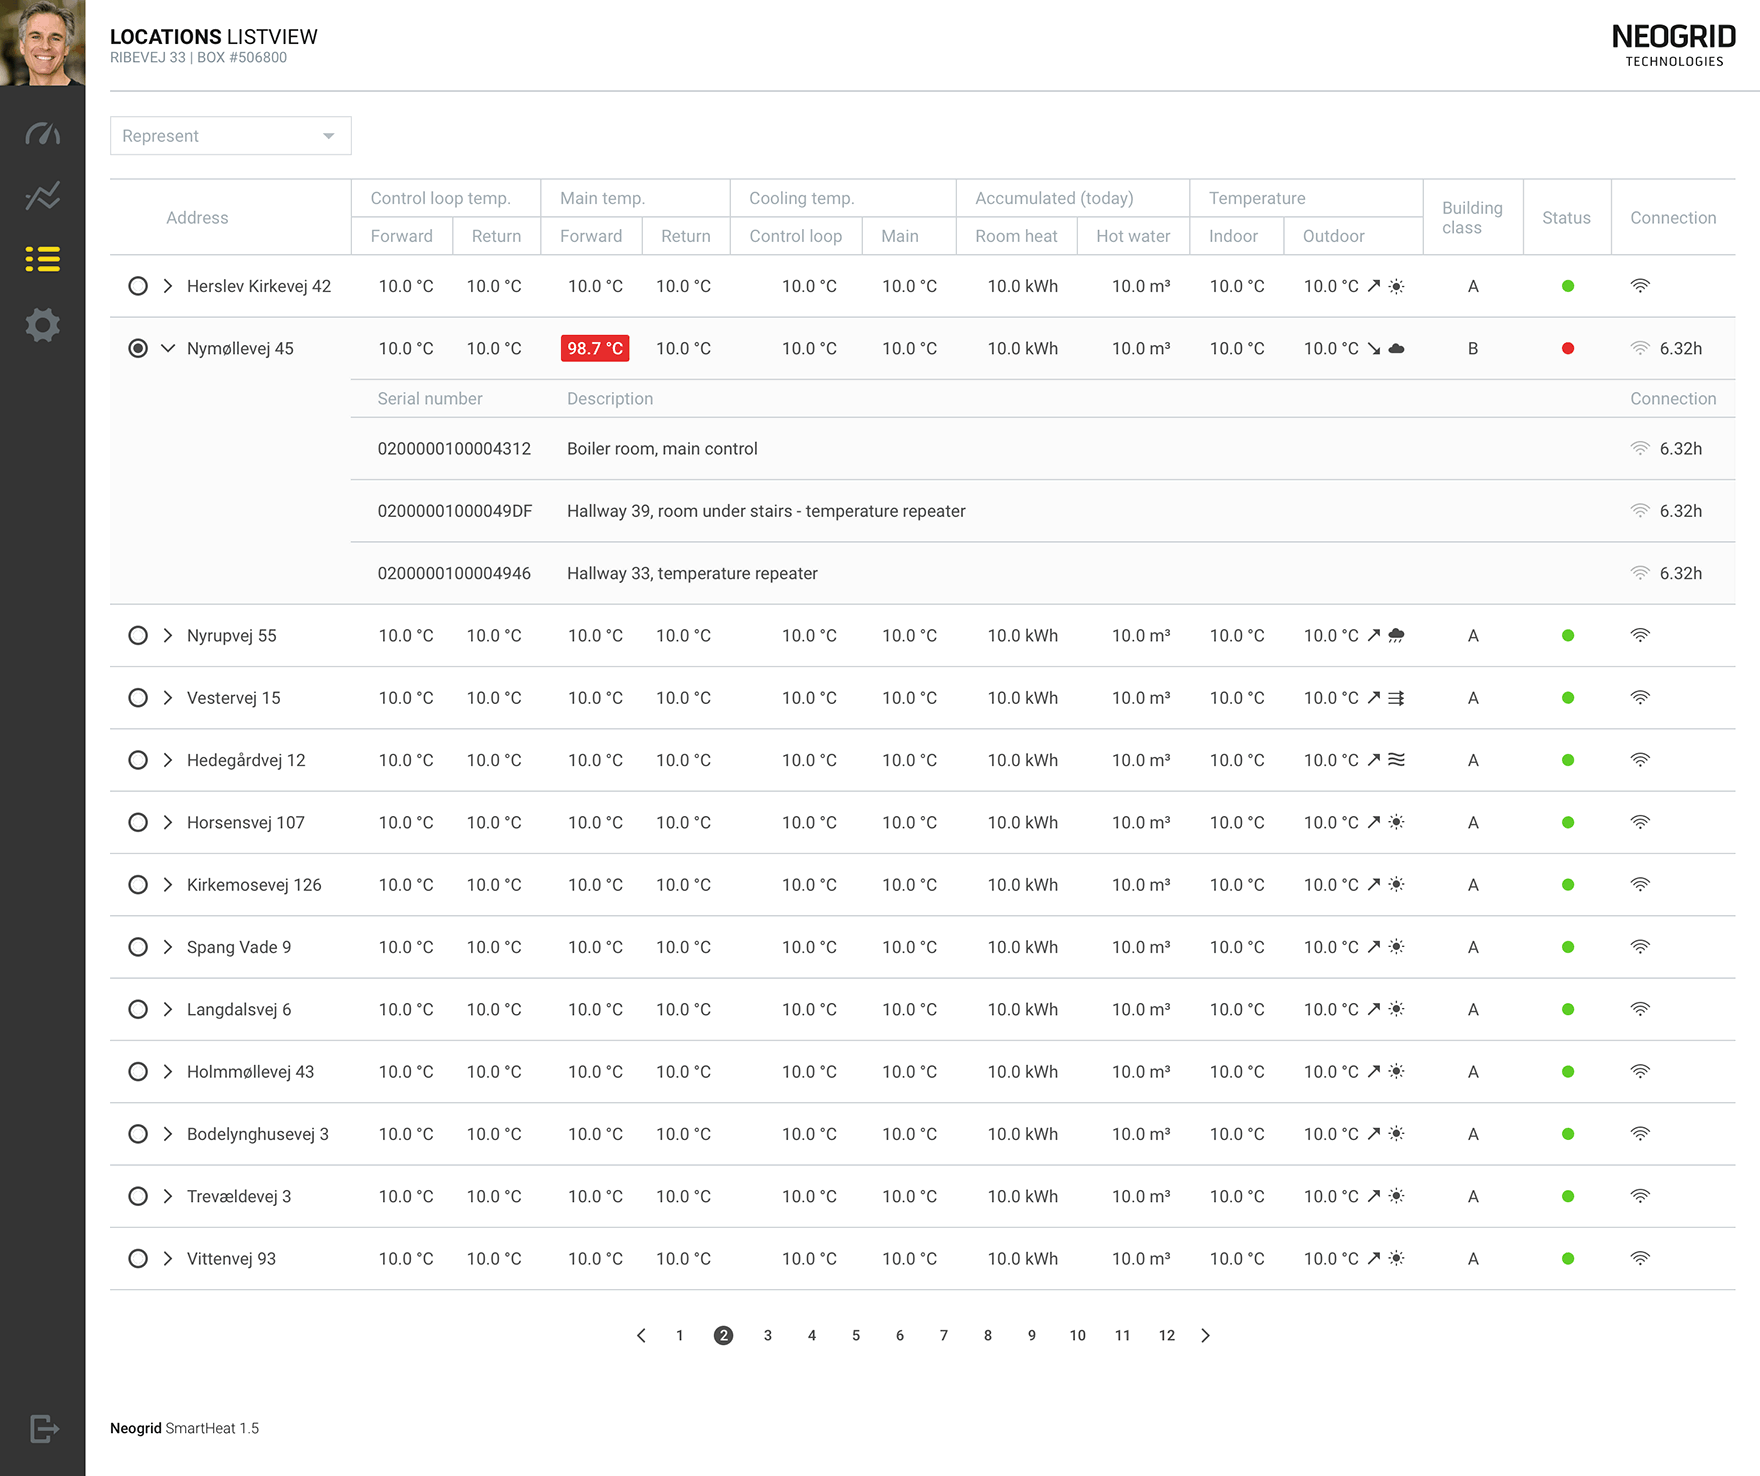
The Locations Listview
Maybe you are not just a domestic user, but the HEO (Heating Executive Officer) of a Fortune 100 company (OK, we made up this HEO thing). But, more often than not, PreHEAT will save serious money in large scale implementations, such as office buildings or large residential complexes.
Enter the Locations Listview, a highly detailed list of locations as well as key parameters – various temperature values, heat consumption, buildings’ thermal classification, sensors’ status, even the weather forecast. You can select a location for more detailed... details.